Dr. Green and White Odds Update: The Sorting Hat
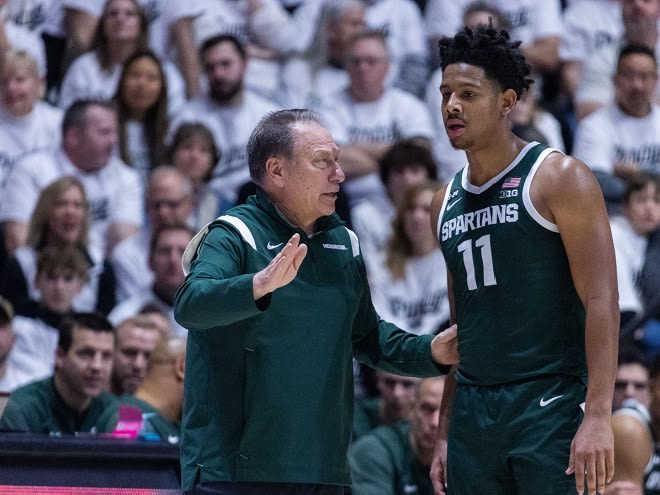

This may feel like cold comfort to Michigan State fans, but based on the results of the past few weeks, I think that it is fair to label the Spartans as "the team that lived."
Yes, the Spartans just returned from Mackey Arena in West Lafayette with a double-digit loss to Purdue. Yes, over the past seven games, the Spartans have also dropped games at Indiana and at Illinois. But in 2019, Cassius Winston and Xavier Tillman didn't get wins in those buildings either.
The Spartans also lost a home game to Purdue in that span. But Michigan State made up for it by taking down Wisconsin at the Kohl Center. MSU also managed to protect home court against Rutgers and Iowa.
While it would have been nice to post a record better than 3-4 in that stretch, the Spartans survived and now they have a chance to advance.
How did the events of the past week impact Michigan State's season outlook and place in the Big Ten race? Let's dig into the numbers to find out.
Updated Big Ten Standing, Wins, and Odds
Table 1 below shows the updated enhanced Big Ten standings with 51% of the regular season now complete.
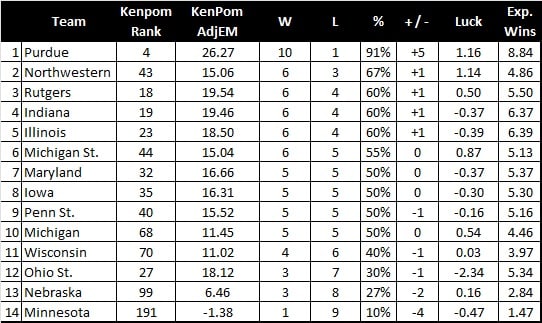
Purdue continues to be Head Boy of the Big Ten house with a record of 10-1 and a very strong plus/minus rating of plus-five (+5). Following the Boilermakers is a group of nine total teams with either five or six wins, including Michigan State.
As for luck (also known as "grit" or the ability to win toss-up games), only Purdue, Northwestern and Michigan State have scores significantly greater than +0.5. Ohio State (-2.34) is the only team with less than a half game of negative luck. The 10 remaining Big Ten teams are close to neutral in this metric.
Table 2 below shows the updated Big Ten win matrix as of Jan. 30 and based on the results of a 100,000-cycle Monte Carlo simulation which uses Kenpom efficiencies to derive the odds for all remaining Big Ten games.
You must be a member to read the full article. Subscribe now for instant access to all premium content.
-
Members-only forums
-
Predict prospect commits with FanFutureCast
-
Exclusive highlights and interviews
-
Exclusive coverage of Rivals Camp Series
-
Breaking recruiting news